AnnData is the
convention single-cell and spatial biology tools use to keep a
measurement matrix together with its annotations. Written to Zarr, it
becomes a group hierarchy with fixed member names: X holds
the main matrix, obs describes the observations (cells or
spots), var describes the variables (genes), and
obsm holds alternative per-observation representations such
as embeddings.
Reading one is a matter of knowing those names. The example here is a
10x Visium human lymph node section published by Vitessce, read over HTTPS — see
vignette("remote-stores") for connection details.
Opening the store
This store publishes no consolidated metadata, so pizzarr cannot list
what it contains — an HTTP server offers no equivalent of
ls. That is the normal case for AnnData stores, and it is
workable only because the member names are fixed by the convention: you
address obs, obsm, and X by name
rather than discovering them.
g <- zarr_open_group(HttpStore$new(root))Observation annotations
obs is a group, not an array. Which of its members holds
the observation identifiers is recorded in its _index
attribute rather than fixed by name, so the lookup goes through the
attributes:
obs_attrs <- g$get_item("obs")$get_attrs()$to_list()
index_colname <- obs_attrs[["_index"]]
index_colname
#> [1] "_index"
index_arr <- g$get_item(paste0("obs/", index_colname))$get_item("...")$data

length(index_arr)
#> [1] 3861
head(index_arr, 3)
#> [1] "AAACAAGTATCTCCCA-1" "AAACAATCTACTAGCA-1" "AAACAGAGCGACTCCT-1"
Those are barcodes identifying the 3861 spots on the slide. Cluster assignments live alongside them under the same group:
cluster_arr <- g$get_item("obs/clusters")$get_item("...")$data

table(cluster_arr)
#> cluster_arr
#>   0   1   2   3   4   5   6   7   8
#> 665 661 654 507 447 352 279 171 125
Embeddings
obsm holds per-observation matrices — one row per spot,
as many columns as the representation needs. A UMAP embedding is two
columns:
umap_arr <- g$get_item("obsm/X_umap")$get_item("...")$data

dim(umap_arr)
#> [1] 3861    2
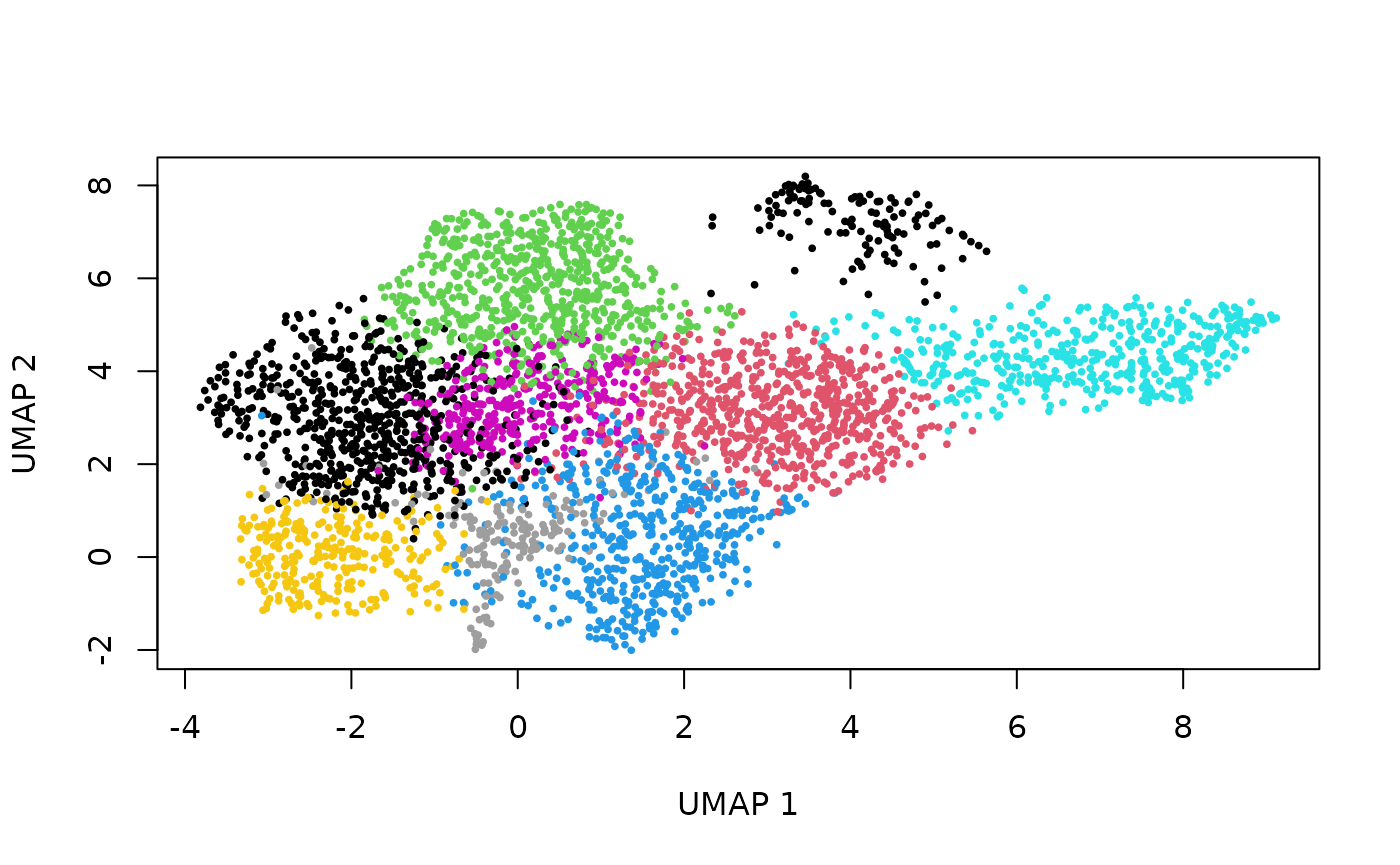
Plotting the embedding coloured by cluster gives the standard view of this kind of dataset:
plot(umap_arr[, 1], umap_arr[, 2],
     col = as.integer(as.factor(cluster_arr)),
     pch = 19, cex = 0.4,
     xlab = "UMAP 1", ylab = "UMAP 2")